Kaspi.kz: A Bargain Straight Out of Kazakhstan?
An analysis of Kaspi.kz at 105.21 USD, a company almost nobody in Portugal has heard of that earns more than 2 billion dollars a year in a country of 20 million people.
By Ricardo Alves · · 24 min de leitura
- Company
- Kaspi.kz
- Ticker
- KSPI
- Exchange
- Nasdaq
- Sector
- Fintech and e-commerce
- Share price on the date
- US$105.21
- ISIN
- US48581R2058
Brief summary
Kaspi.kz is, for me, one of the strangest companies I have ever analysed, and I mean strange in the good sense. It is a mobile phone app used by practically every adult in an entire country, Kazakhstan, to pay bills, buy things, borrow money and keep savings. It has the margins of a bank, the growth of e-commerce, and it needs no great investment in factories or machinery. In 2025 it made 2,112 million dollars of profit and had a return on equity (ROE) of around 53%. And even so, Kaspi trades at a P/E of roughly 9, when any Western company with these numbers would trade above 20, and it pays around 7.9% in annualised dividend yield.
Now the honest part, and this is why the title has a question mark in it. The discount is not irrational. Almost all of the profit comes from a single country, wedged between Russia and China, with a historically weak currency and a regulator that has already proved it changes the rules halfway through the game. On top of that, management bought Hepsiburada, one of the largest e-commerce sites in Turkey, which multiplies the potential market from 20 to more than 100 million people, but which also imported Turkish inflation, losses and execution risk.
Before we start
This company uses a lot of specific, technical vocabulary, and I do not want anyone getting lost halfway through. If you already know these terms, skip this section without remorse. If not, two minutes reading here will make the rest of the article worth twice as much.
| Term | What it means |
|---|---|
| ADS / ADR | American Depositary Share. Kaspi is a Kazakh company, but whoever buys in New York does not buy the share directly, they buy a receipt called an ADR (American Depositary Receipt), issued by a depositary bank, that represents one share. In practice, 1 ADS = 1 Kaspi share. Every per-share figure in this article is per ADS. |
| Tenge (KZT) | Kazakhstan’s currency. The company reports in tenge and converts to dollars at the rate of the last day of each period. I use the same rates as the company: 454.5 (2023), 525.1 (2024), 505.5 (2025) and 480.72 (30 June 2026) tenge to the dollar. This matters, and I come back to it further on. |
| Super App | A single app that does many things that would normally take ten different apps: payments, shopping, banking, travel, classifieds, government services. It is the WeChat model in China, or Mercado Libre’s in Latin America. |
| GMV | Gross Merchandise Value. The total value of everything sold on Kaspi’s marketplace. Careful: it is not Kaspi’s revenue. Kaspi only keeps a commission on that value. It is like confusing the turnover of an entire shopping centre with the rent the owner of the centre collects. |
| TPV | Total Payment Volume, the total value of the payments processed. Same logic as GMV, but for the payments side. Here too, Kaspi only keeps a small slice. |
| TFV | Total Finance Value, the total value of credit granted in the period. It is how much new money Kaspi lent. |
| Take rate | The effective commission, as a percentage, that Kaspi keeps out of GMV or TPV. If the marketplace take rate is 12%, it means that out of every 100 euros sold on the platform, 12 stay with Kaspi. This is by far the most important metric in this company, because a rise of 1 percentage point in the take rate is worth far more than a rise of 1% in GMV. |
| MAU and DAU | Monthly Active Users and Daily Active Users. The DAU/MAU ratio says what percentage of the monthly users open the app every day. A figure of 68% is extraordinary; most commercial apps sit below 20%. |
| BNPL | Buy Now Pay Later, typically in instalments with no interest for the consumer. Kaspi charges the merchant. |
| NPL | Non-Performing Loans, here defined as loans with instalments more than 90 days overdue, as a percentage of the total portfolio. NPL coverage says how much money the company has already set aside (provisions) to cover those bad loans. |
| Cost of risk | How much the company recognised in expected credit losses in the period, as a percentage of the average portfolio. It is the annual bill for bad loans. Very important: when a quarterly figure appears (0.7%), it does not compare directly with an annual one (2.2%). |
| Adjusted EBITDA | Profit before interest, tax, depreciation and amortisation, with some adjustments. It serves to compare operations in countries with different taxes and interest rates. It is the metric Kaspi switched to for its targets from 2026 onwards, and further on I explain why that is not innocent. |
| ROE | Return on Equity. How much profit the company generates for each euro of shareholders’ capital. A good European bank does 12% to 15%. Kaspi does more than 39%. |
| P/E | Price to Earnings, share price divided by earnings per share. How many years of current profits we are paying for the company. A P/E of 9 means 9 years. |
Numbers I consider relevant
Figures in millions of dollars (M USD) unless stated otherwise. I converted everything at the rates Kaspi itself uses in its reports, so any reader can go to the original releases and check the numbers.
Table 1 — The essential numbers
| Metric | FY2023 | FY2024 | FY2025 | H1 2026 |
|---|---|---|---|---|
| Marketplace GMV (billion USD) | 9.24 | 11.43 | 13.25 | 9.3 |
| Total revenue | 4,210 | 4,822 | 8,004 | 4,561 |
| Adjusted EBITDA | n/a | 2,476 | 3,079 | 1,592 |
| Adjusted EBITDA margin | n/a | 51.3% | 38.5% | 34.9% |
| Net profit | 1,867 | 2,013 | 2,112 | 1,063 |
| Net margin | 44.4% | 41.7% | 26.4% | 23.3% |
| Annualised ROE (average attributable equity) | ~89% | ~80% | ~53% | ~39% |
| Diluted EPS (USD per ADS) | 9.64 | 10.34 | 11.06 | 5.52 |
| Dividend declared (USD per ADS) | 6.49 | 6.47 | 0.00 | 3.85 |
One important note on this table concerns the net margin, and it is the mistake I see repeated in almost everything written about this company. Seeing the margin fall from 41.7% to 26.4% and concluding that the business deteriorated is simply wrong. What happened is that Kaspi started consolidating into its accounts a Turkish retailer that sells its own products, and selling your own products means recording the whole sale as revenue and the cost of the goods as a cost. It is a structurally much lower-margin business that shows up inflating the denominator. Excluding Turkey, the 2025 margin was around 38%, for example.
Table 2 — Operating metrics (this is where the story is)
| Metric | FY2023 | FY2024 | FY2025 | H1 2026 |
|---|---|---|---|---|
| Average MAU — monthly users (Kazakhstan) | 14.0 M | 14.7 M | 15.7 M | n/a |
| Average DAU — daily users | 9.1 M | 10.1 M | 10.7 M | n/a |
| DAU / MAU | 65% | 68% | 68% | n/a |
| Monthly transactions per active consumer | 71 | 73 | 77 | 77 |
| Total active consumers (Kazakhstan + Turkey) | — | — | — | 26.6 M |
| Active merchants | 581 K | 737 K | 764 K | ~900 K |
| TPV — Payments (billion USD) | 62.5 | 70.8 | 87.4 | 49.9 |
| Take rate — Payments | 1.23% | 1.18% | 1.10% | 1.01% |
| Marketplace GMV (billion USD) | 9.24 | 11.43 | 13.25 | 9.3 |
| Take rate — Marketplace | 9.2% | 9.7% | 10.5% | 12.1% |
| e-Commerce GMV (billion USD) | 3.30 | 5.33 | 6.33 | 5.2 |
| Take rate — e-Commerce (3P) | 11.0% | 11.3% | 12.7% | 15.9% |
| Annual purchases per e-Commerce consumer | — | — | 24.8 | 15.8 |
| Average net loan portfolio (billion USD) | — | — | — | 15.1 |
| Average loan duration (months) | — | — | 7.8 | 9.1 |
| Average cost of funding (term deposits) | — | — | 12.5% | 14.4% |
| Cost of risk | 2.0% | 2.1% | 2.2% | 0.7% |
| NPL (more than 90 days) | 5.5% | 5.4% | 6.1% | 7.0% |
| NPL coverage by provisions | — | — | 80% | 76% |
| Loans / Deposits ratio | 78% | 88% | 95% | 91% |
| Equity / Assets | 16.2% | 18.8% | 23.5% | 22.6% |
| Regulatory capital ratio (Tier I) | — | — | 12.7% | 14.1% |
| Effective tax rate | 17.0% | 17.6% | 19.8% | 21.4% |
Table 3 — Where the money comes in (by segment)
Kaspi splits into three platforms, and this is the table that helps me understand the company most. Figures in millions of dollars, Kazakhstan only, with Turkey isolated on the last line.
| Segment | Revenue 2023 | Revenue 2024 | Revenue 2025 | Profit 2023 | Profit 2024 | Profit 2025 |
|---|---|---|---|---|---|---|
| Payments | 1,053 | 1,118 | 1,303 | 680 | 727 | 857 |
| Marketplace * | 986 | 1,396 | 1,780 | 546 | 663 | 730 |
| Fintech | 2,259 | 2,441 | 3,052 | 642 | 622 | 702 |
| Turkey (Hepsiburada) | — | — | 2,041 | — | — | −184 |
* Marketplace profit excluding Turkey, as the company publishes it (KZT 369 billion). That is why the sum of the three platforms (2,289) comes out 7 million below the total Kazakhstan profit (2,296): the difference is Turkish items that are not allocated to Marketplace, mostly interest on the bonds issued to finance the acquisition, and currency effects.
Payments plus Marketplace gave 69% of Kazakhstan’s profit in 2025 (66% in 2023, 69% in 2024). For me this is the most important figure in the whole analysis, and that is because they are the two platforms that consume almost no capital. Fintech is the one that needs a balance sheet, with a loan portfolio of 14.2 billion dollars at the close of 2025 and 15.5 billion at 30 June 2026, and it is the one that suffers when interest rates rise.
For the first half of 2026 the company no longer publishes profit by segment, only Adjusted EBITDA, which is unfortunately a loss of information. Here is what there is, with both periods converted at the same rate (480.72) so that they are comparable with each other.
| Segment | Revenue H1 2025 | Revenue H1 2026 | Chg. | Adj. EBITDA H1 2025 | Adj. EBITDA H1 2026 | Chg. |
|---|---|---|---|---|---|---|
| Payments | 642 | 681 | +6% | 393 | 391 | −0.4% |
| Marketplace | 1,681 | 2,139 | +27% | 464 | 512 | +10% |
| Fintech | 1,484 | 1,840 | +24% | 631 | 688 | +9% |
| Consolidated total * | 3,722 | 4,561 | +22.5% | 1,488 | 1,592 | +7% |
* The sum of the three segments’ revenue does not equal consolidated revenue, because there are intersegment eliminations and the rewards line (points and cashback given back to customers) to subtract. I used the consolidated figure from the income statement.
Table 4 — The currency effect, read this before quoting any growth figure
This is the point almost every article about Kaspi gets wrong, and it is worth stopping here for a minute. The company earns in tenge and the shareholder in Lisbon earns in euros or dollars. If the tenge falls, the same operating performance translates into a worse return for us.
| Growth | 2024 | 2025 | H1 2026 |
|---|---|---|---|
| Revenue, in tenge | +32.3% | +59.8% | +22.5% |
| Revenue, in dollars | +14.5% | +66.0% | +22.5% |
| Net profit, in tenge | +24.5% | +1.0% | −0.4% |
| Net profit, in dollars | +7.8% | +4.9% | −0.4% |
The 2026 column is calculated at a constant exchange rate of 480.72 tenge to the dollar in both periods, in order to isolate operating performance.
Look at 2024. The company increased profit by 24.5% in its own currency, but a shareholder in dollars only saw 7.8% more. The tenge went from 454.5 to 525.1 to the dollar that year, which is to say it lost 13.4% of its value, and that ate two thirds of the growth. The crudest example is the dividend, and this is my favourite one for explaining the problem to anyone who has never thought about it. In 2023 Kaspi declared KZT 2,950 per ADS. In 2024 it declared KZT 3,400. So it raised the dividend by 15% in its own currency, which any shareholder would applaud. And how much was that worth to whoever gets paid in dollars? 6.49 dollars in 2023 and 6.47 dollars in 2024. Two cents less. The company raised the dividend by 15% and the foreign investor received precisely nothing.
The good news is that in 2026 the wind turned. The tenge went from 505.5 at the end of 2025 to 480.72 at 30 June 2026, which is to say it appreciated by around 5%. For the first time in years the exchange rate is helping instead of getting in the way.
Short introduction
I want to start by saying, as I did in the Mota-Engil analysis, that I hold shares in this listed company, and so I will do my best to be as impartial as possible.
I thought this was a good moment to analyse Kaspi because the company reported first-half results on 10 August, less than two weeks ago, and because it seems to me that almost nobody in Portugal looks at it. And they should.
Kazakhstan is a country in Central Asia, between Russia and China, with around 20 million inhabitants, rich in oil and in uranium. It is a country where traditional banks and organised retail never really developed very far, and that is exactly where the opportunity Kaspi took lies.
Kaspi.kz is a mobile phone app. One single app. And in that app a Kazakh pays the water and the electricity, sends money to a friend, buys a fridge in instalments, does the supermarket shopping, books a holiday, sells the used car, asks the state for a birth certificate, takes out a personal loan and keeps savings earning interest. All in the same place, with the same biometric identification.
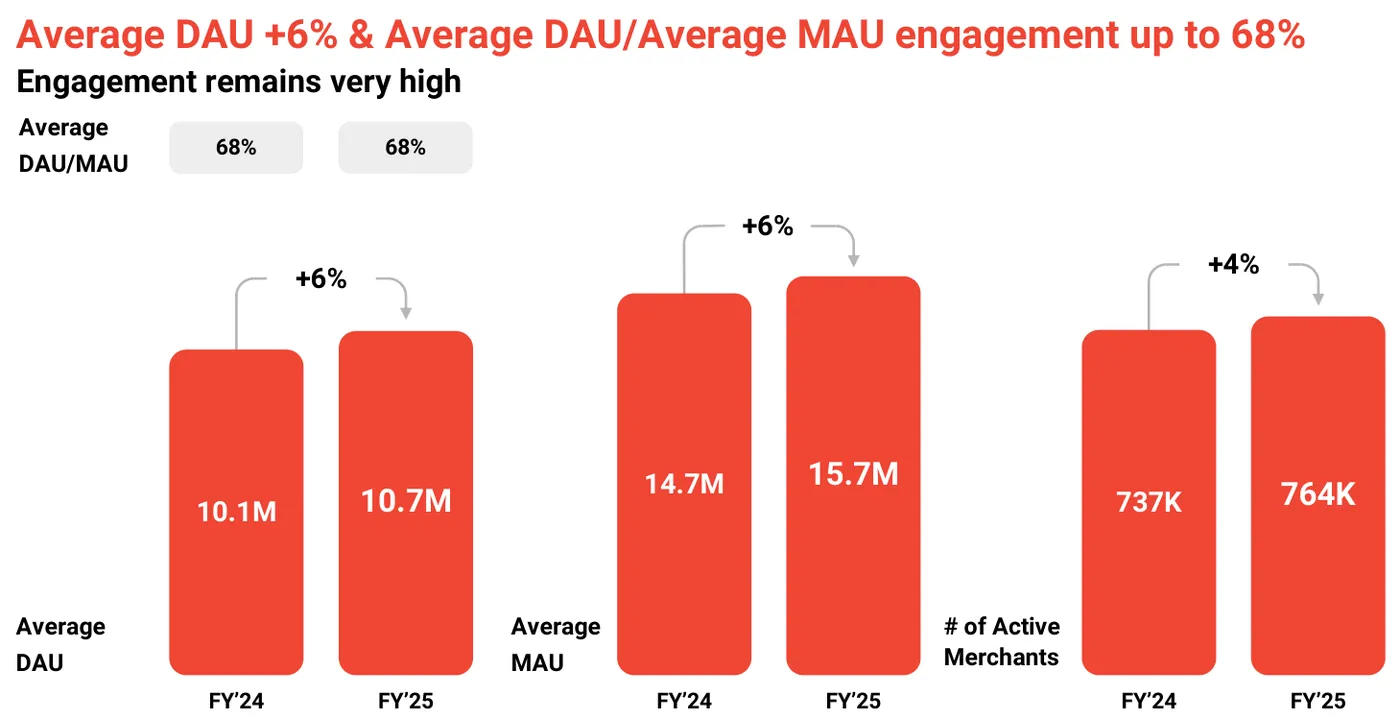
The scale is hard to convey to anyone sitting in Portugal, so here are some numbers. In a country of 20 million people, Kaspi has 15.7 million monthly active users. Of those, 10.7 million open the app every day, which gives a DAU/MAU ratio of 68%. Each active consumer makes 77 transactions a month with Kaspi. This is not an app that people use, it is a country’s payments infrastructure.
Two notes that give me confidence in the credibility of the story. The first is that Harvard Business School published a case study on this company in May 2024, which does not happen with dubious companies. The second is that it has been on the Nasdaq since January 2024, with accounts audited under IFRS, which is to say under the same accounting rules as a listed Portuguese company. It is not an obscure vehicle on a peripheral exchange.
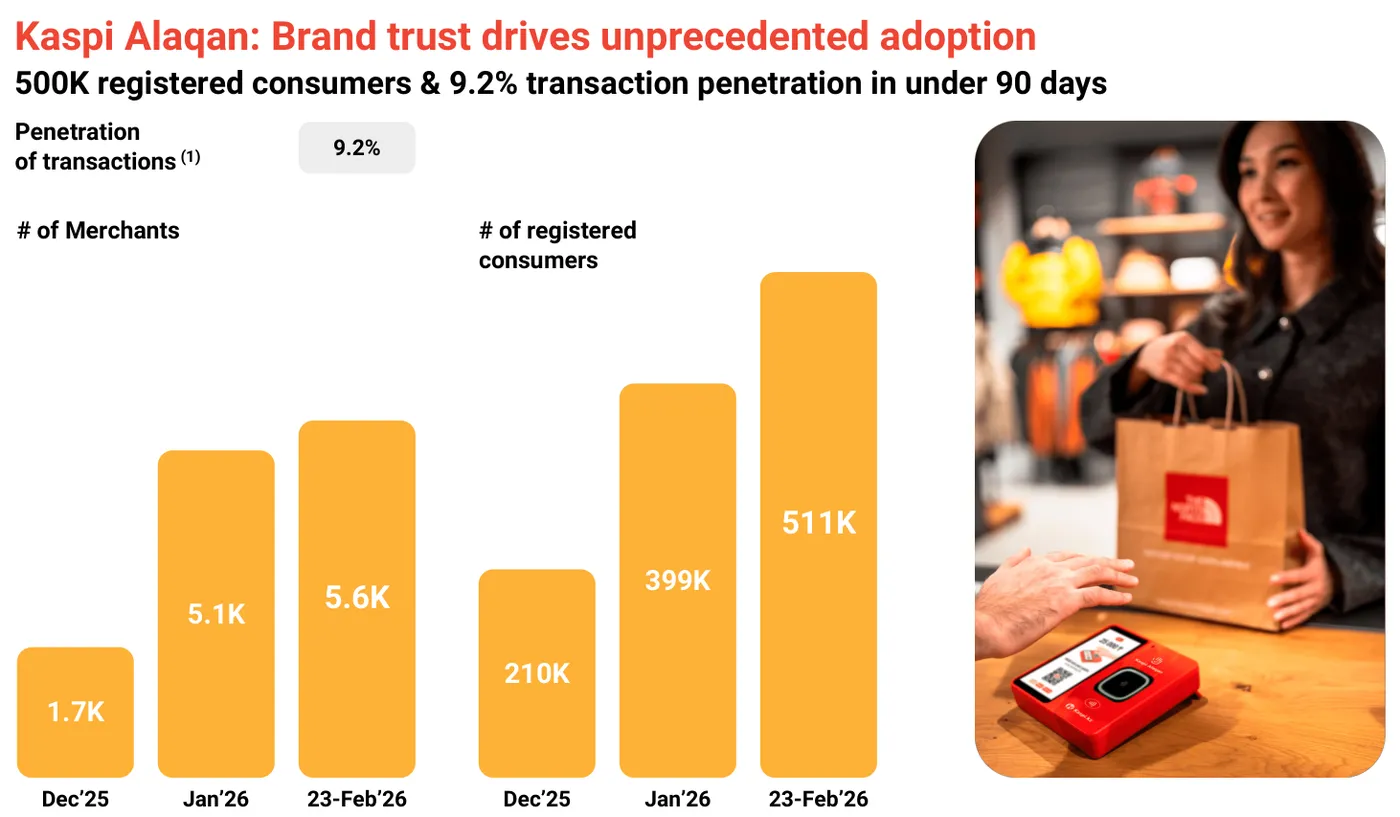
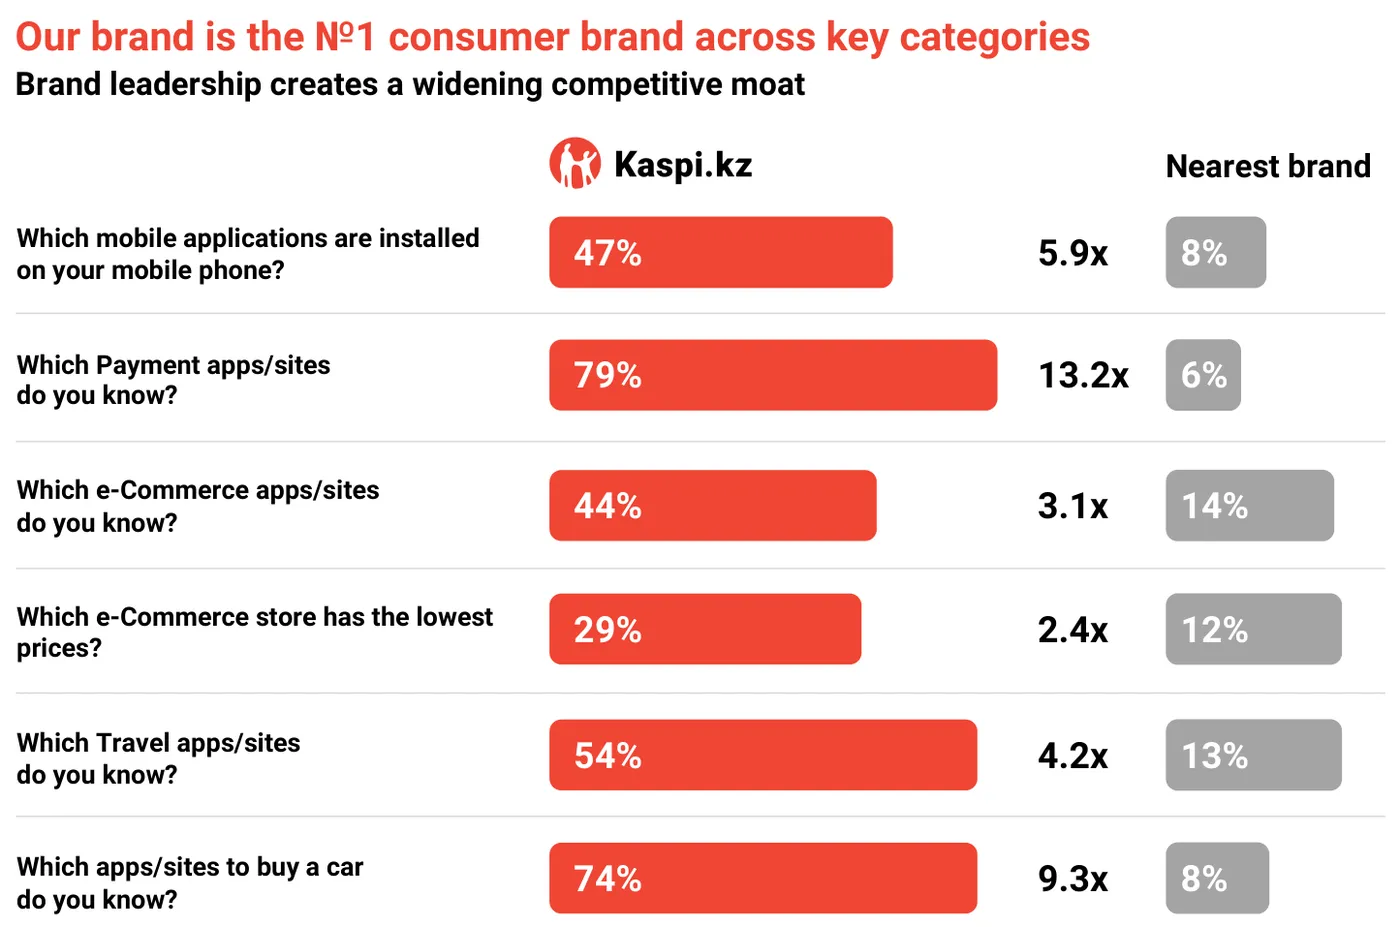
Here is a concrete example of this company’s brand power, because it illustrates the point better than any ratio. In December 2025 Kaspi launched Kaspi Alaqan in Almaty, the country’s largest city, which is paying with the palm of your hand. No card, no phone, no code. In less than three months around a third of the city’s adult population registered their palm in a Kaspi database. Now, that only happens with a company people trust deeply, and that trust is the real competitive moat here, more than the technology.
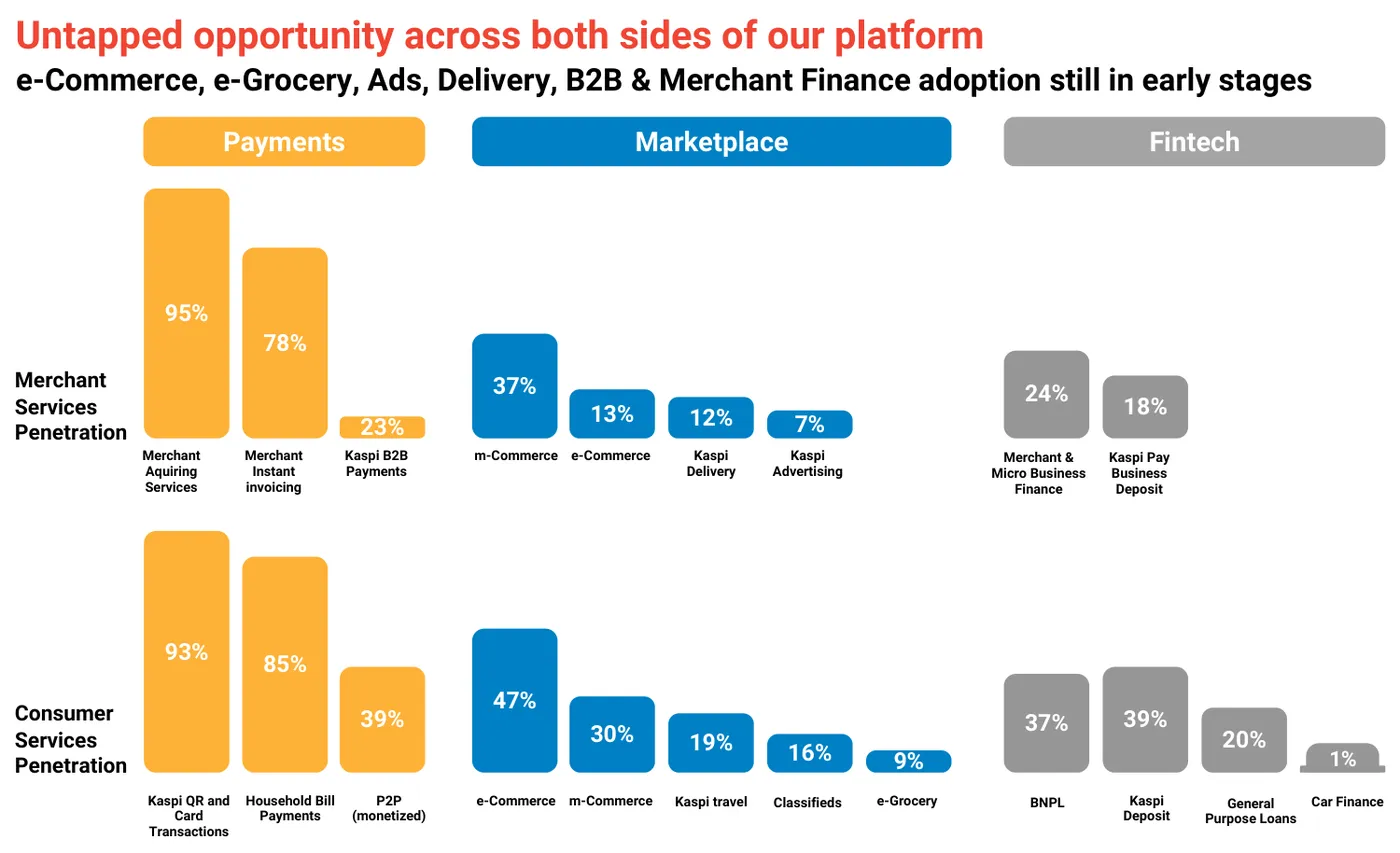
The company is organised into three platforms, and I am going to explain them simply because the rest of the analysis rests on this:
-
Payments. It is the traffic engine. People come into the app to pay bills and transfer money, and Kaspi charges a small commission on that volume. In 2025, 87.4 billion dollars went through here, at an average commission of 1.10%. It is the platform that brings people in every day and the one that consumes almost no capital.
-
Marketplace. It is the digital shopping centre. Merchants sell, consumers buy, Kaspi keeps a commission. Inside Marketplace there is classic e-Commerce (buying online and having it delivered at home), m-Commerce (buying in a physical shop, using the app to pay in instalments), e-Grocery (the supermarket), travel, car and property classifieds, and advertising. This is the area that grows fastest and where the commission is rising.
-
Fintech. It is the bank. Consumer credit, BNPL, car loans, merchant loans, and deposits to fund all of it. It is the platform that needs capital and the one that suffers with high interest rates, but it is also the one that closes the circle: whoever buys on the marketplace finances the purchase in Fintech and pays through Payments.
And then there is Turkey, which from 2025 onwards became the fourth piece. On 29 January 2025 Kaspi bought 65.41% of Hepsiburada, one of the largest Turkish e-commerce sites, for around 1,127 million dollars. It has been raising the stake ever since and today holds 86.7%. In July 2026 it completed the purchase of Rabobank A.Ş., a licensed Turkish bank that it renamed Hepsi Bank, into which it will inject around 300 million dollars. The logic is transparent: replicate in Turkey what worked in Kazakhstan, which is to say glue credit onto e-commerce. The addressable market jumps from 20 to more than 105 million people.
Fundamental analysis
On Kazakhstan
As far as the fundamental analysis goes, I think the numbers above speak for themselves.
As we have seen, Kaspi is a monopoly present in the daily life of the citizens and the services of Kazakhstan.
The first half of 2026 is, summed up in one sentence, a half-year of good operations and a bad income statement.
Revenue grew 22.5% in tenge, to 2,192,782 million (4,561 M USD). Adjusted EBITDA grew 7%, to 765,101 million (1,592 M USD). And net profit came out practically unchanged, at 510,796 million (1,063 M USD), against 512,678 million a year earlier. In other words, 22.5% more revenue, zero more profit.
Where was it lost? The company gives the breakdown of the second-quarter net margin, which went from 26.7% to 23.3%, and it is worth looking at because it is very clear:
- Interest cost: 3.1 percentage points of margin less. It is by far the biggest factor and accounts for practically the whole fall.
- Cost of goods sold: 1.1 points more (a positive effect, a better mix).
- Technology and product: 0.5 points less.
- Sales and marketing: 0.4 points less.
- General and administrative expenses and other: 0.2 points less.
- Provisions: 0.6 points less.
- Tax: 0.3 points more.
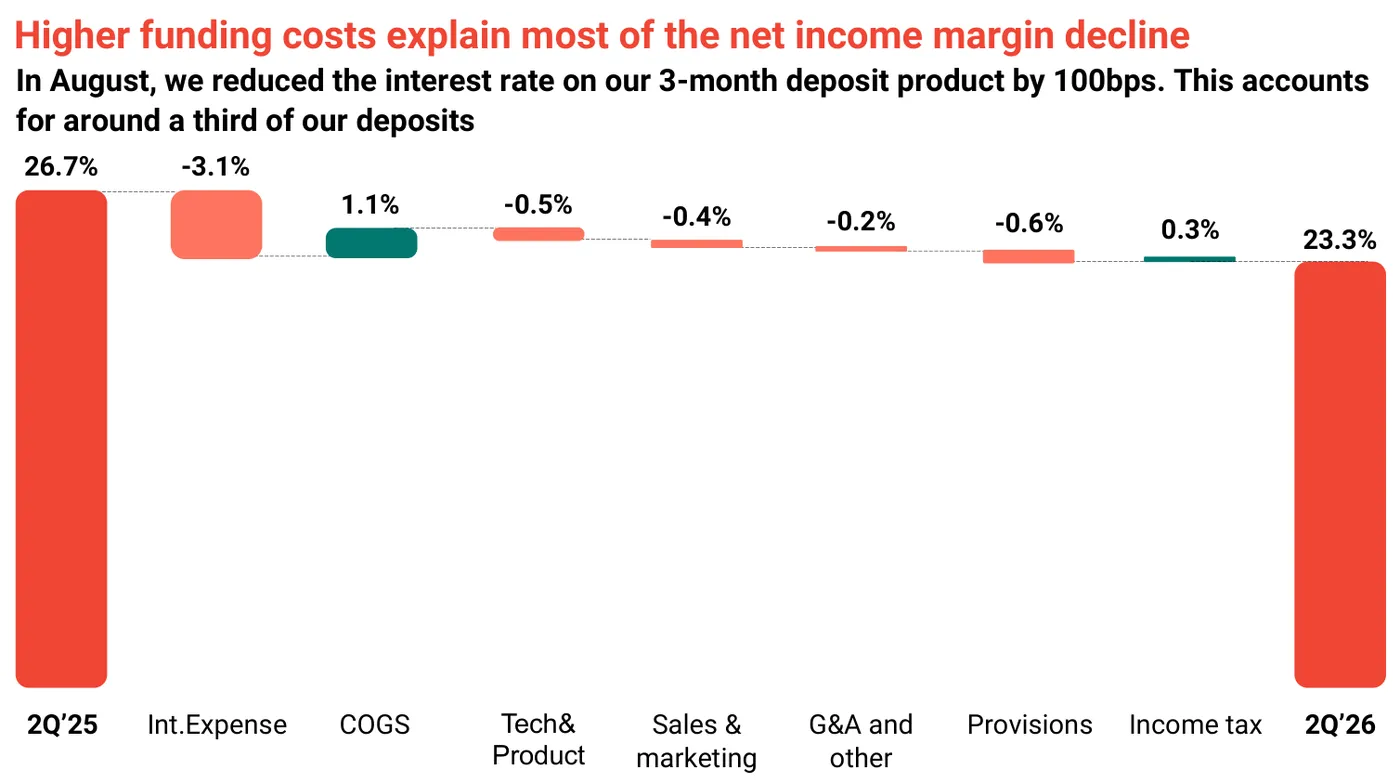
It is almost all the cost of money. Interest and fees paid rose 38% over the half-year, from 401,354 to 553,546 million tenge, far above revenue’s 22.5%. The average cost of term deposits rose from 12.5% to 14.4%.
Translating that into plain English, Kaspi is paying much more for depositors’ money and has not managed to pass all of it on to the interest it charges.
This is not bad management, it is the National Bank of Kazakhstan raising the base rate to fight inflation, plus the increase in minimum reserve requirements in August 2025 and another in April 2026, plus the rise in the bank tax from 20% to 25% from January 2026. The group’s effective tax rate went from 18.5% to 21.4% over the half-year. These are three things external to the company happening at the same time, and management warned about it in March, in so many words, in the letter to shareholders.
And here is the most interesting part. In August 2026, which is to say after the half-year had closed, Kaspi cut by 100 basis points the rate it pays on the three-month deposit, which is around a third of its deposits. It was the first cut in more than two years. Inflation in Kazakhstan has begun to moderate and the company says explicitly that the 2026 target assumes no interest rate cuts at all. In other words, the base case is already built without this help, and the help has started. If the interest rate cycle turns in its favour (and it looks as though that is what is happening), this drops straight into profit, and it drops with leverage, because the loan portfolio is 15.5 billion dollars.
On Turkey
Around 1,290 million dollars have already gone into Hepsiburada (1,127 on the initial purchase, plus 66 and plus 97 on increases in the stake) and around 300 million will go into Hepsi Bank. It is a lot of money, and it is fair to ask whether it is well spent.
The thesis is simple: Hepsiburada has more consumers than Kaspi has in Kazakhstan, but it uses them far worse. The company publishes the comparison itself, and it is brutal.
| Metric (2025) | Kaspi.kz (Kazakhstan) | Hepsiburada (Turkey) | Difference |
|---|---|---|---|
| Consumers | 7.4 million | 11.8 million | 1.6x more |
| GMV per consumer | KZT 332,000 | KZT 212,000 | 1.6x less |
| Purchases per consumer | 24.8 | 6.7 | 3.7x less |
| Growth in engaged consumers | 66% | 29% | 2.3x less |
In other words, Hepsiburada has a larger customer base than Kaspi’s, and each customer buys less than a third as often. If Kaspi manages to take those 6.7 purchases a year to, say, 12 or 15 (without even getting close to Kazakhstan’s 24.8), we are talking about an enormous increase in revenue on a cost base that already exists. That is why the purchase makes sense conceptually.
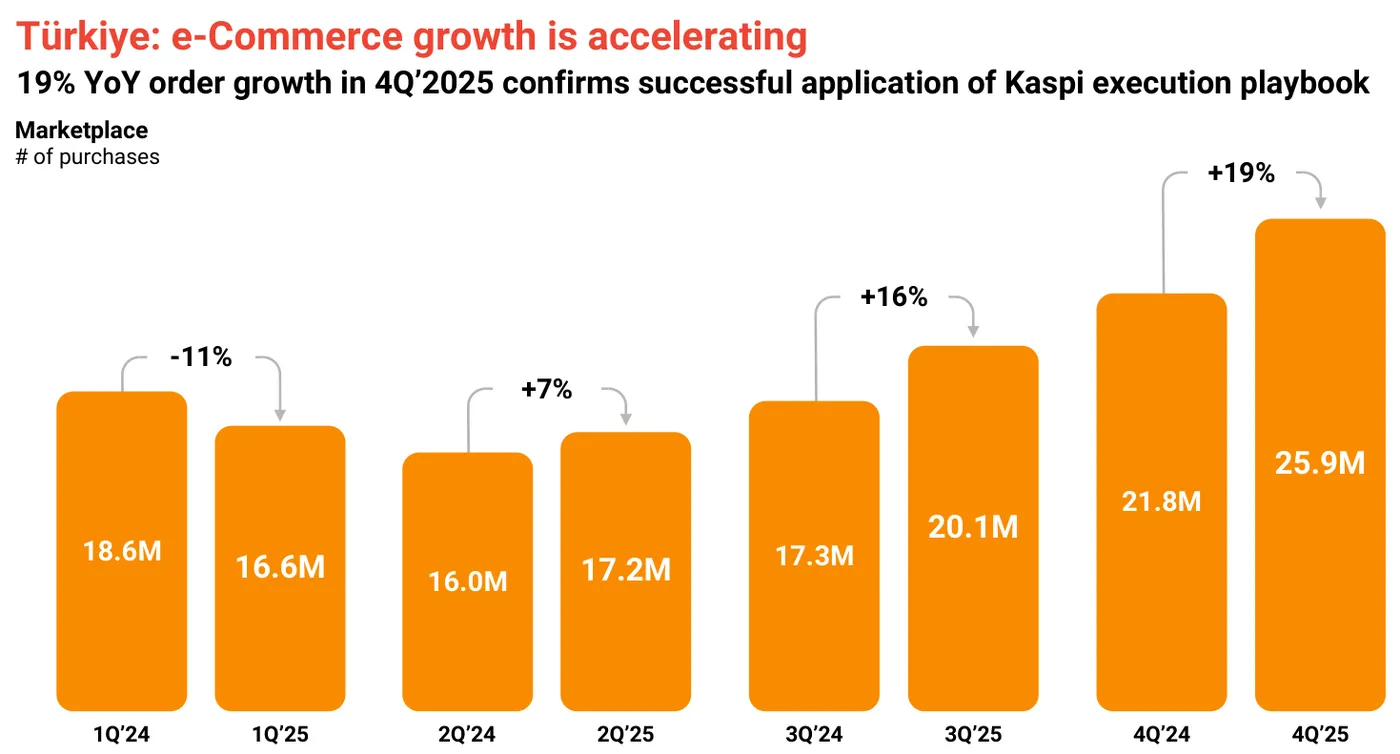
And is it working? Slowly, but yes. The growth series for purchases on Hepsiburada through 2025 was, by quarter: −11% (Q1), +7% (Q2), +16% (Q3) and +19% (Q4), which is an unmistakable acceleration. Turkish revenue grew 39% in tenge in the first half of 2026 and is already 25% of consolidated revenue. They launched Hepsicredit, which is credit built into the purchase process itself, making use of the microfinance licence Hepsiburada already had, and in June it was 0.4% of GMV. In July the purchase of the bank was completed, which is what allows this to scale properly, because it is credit that turns a thin-margin marketplace into a business like the one in Kazakhstan.
On shareholder returns
Kaspi suspended the dividend for the whole of 2025 in order to pay for Hepsiburada. Zero. After having distributed 646,056 million tenge in 2024. For a share that many people held precisely for the dividend, it was a shock, and it was legitimate to ask whether the dividend would come back and at what level.
It came back on 27 February 2026, at KZT 850 per ADS per quarter, and management said it was sustainable at least for the rest of 2026. It kept it in the first quarter. And on 10 August it proposed raising it by 18%, to KZT 1,000 per ADS. So it promised, it delivered, and by the second quarter it was already increasing it. This is the kind of thing that makes an investor trust a management team again, and there is no ratio that stands in for it.
Annualising the current dividend gives KZT 4,000 per ADS, which at the rate of 480.72 is 8.32 dollars.
KZT 1,000 × 4 = KZT 4,000 ÷ 480.72 = 8.32 USD per ADS
At the current price (105.21 USD), this annualised dividend would give an annual yield of around 7.9%.
As for guidance, Kaspi does not give a net profit target, only Adjusted EBITDA. So I am going to use two routes and see whether they arrive at the same place.
The first route is the profit of the last twelve months, which does not depend on any forecast of mine. Diluted earnings per share for 2025 was KZT 5,592, for the first half of 2025 it was KZT 2,664 and for the first half of 2026 it was KZT 2,654. Adding and subtracting:
KZT 5,592 − KZT 2,664 + KZT 2,654 = KZT 5,582 per ADS (last 12 months)
KZT 5,582 ÷ 480.72 = 11.61 USD per ADS
105.21 USD ÷ 11.61 USD = 9.1 P/E
The second route is to estimate the whole of 2026, and here an assumption of mine does come in. In 2025 the first half was worth 47.6% of the year’s profit (KZT 2,664 out of a total of KZT 5,592), because the second half has Christmas in it and is stronger. I only have one year in which the company reports this way, so this is a reference and not a rule. Applying the same seasonality to the 2026 half-year:
KZT 2,654 ÷ 0.476 = KZT 5,575 of profit per ADS estimated for 2026
KZT 5,575 ÷ 480.72 = 11.60 USD → 105.21 ÷ 11.60 = 9.1 P/E
The two routes give the same answer, which leaves me more comfortable: we are paying around 9 years of current profits for this company. I will add the book value, because in a bank that matters. Equity attributable to shareholders is 5,490 M USD and the market capitalisation is around 20.0 billion, which gives a P/B of 3.6 times, with a ROE of 39%.
Being conservative, and bearing in mind all the risks I set out below, a P/E that would seem acceptable to me for this company would be around 12. It is not a demanding multiple. For context, Nubank, which is probably the closest comparable in spirit (a dominant fintech in an emerging market, also listed in New York), was trading at 19.9 times earnings at the close on 21 August. So even at the 12 times I use, there would still be a 40% discount to Nubank.
12 × 11.60 USD = 139.20 USD per ADS
That gives an upside potential of around 32% against the current 105.21 dollars, to which I would add the 7.9% annual dividend.
If the interest rate cycle in Kazakhstan turns (and I will take the chance to stress that the country benefits from a rise in the oil price), which is not in management’s own base case, profit rises and the multiple probably expands at the same time, which is the combination that makes a share take off.
Technical analysis
As for the technical analysis, over the long term:
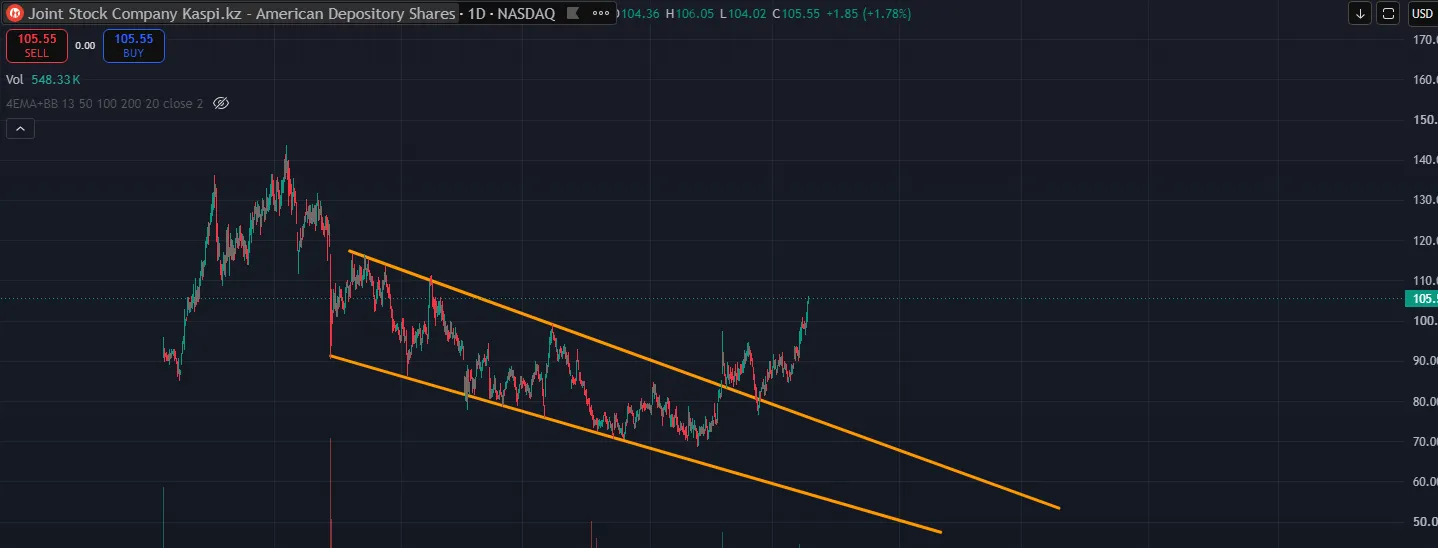
We can see that, since 2024, the price was in a descending channel, more precisely in a descending wedge, which was broken in April 2026.
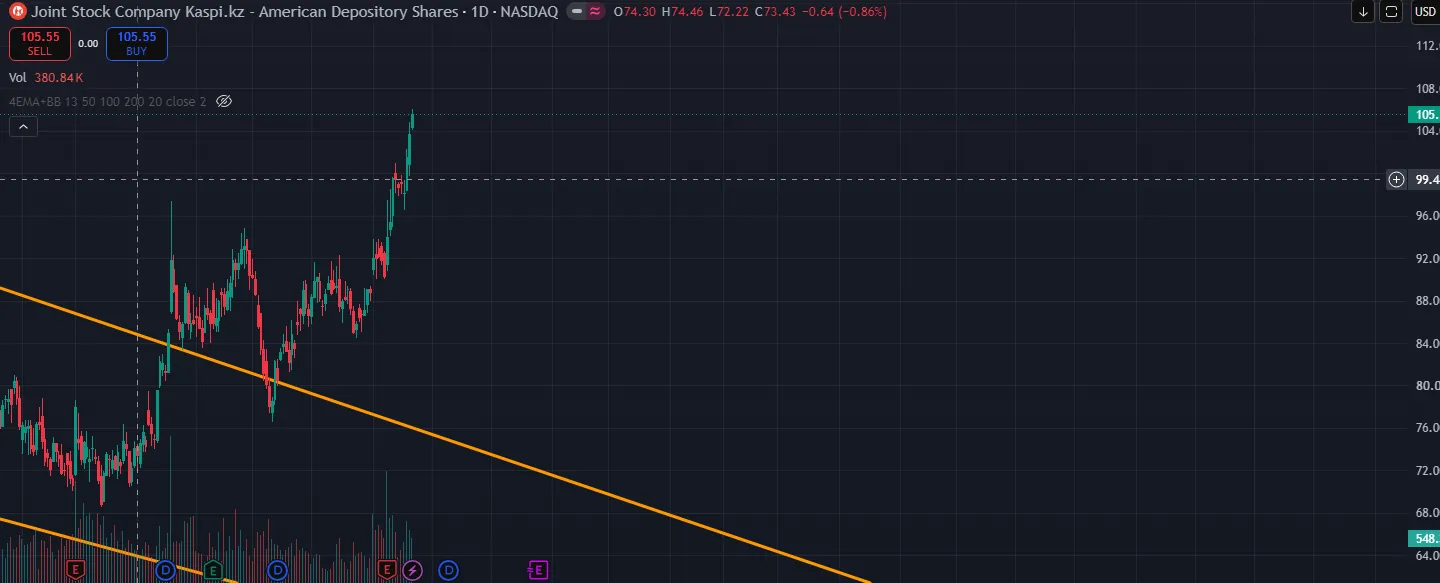
After clearing this descending wedge, we have already had a test of the upper trendline, where support was confirmed, with the price carrying on up from there.
Zooming in further and staying on the daily view, we can see a pattern investors know well. An inverted Head and Shoulders, which appears to have been respected.
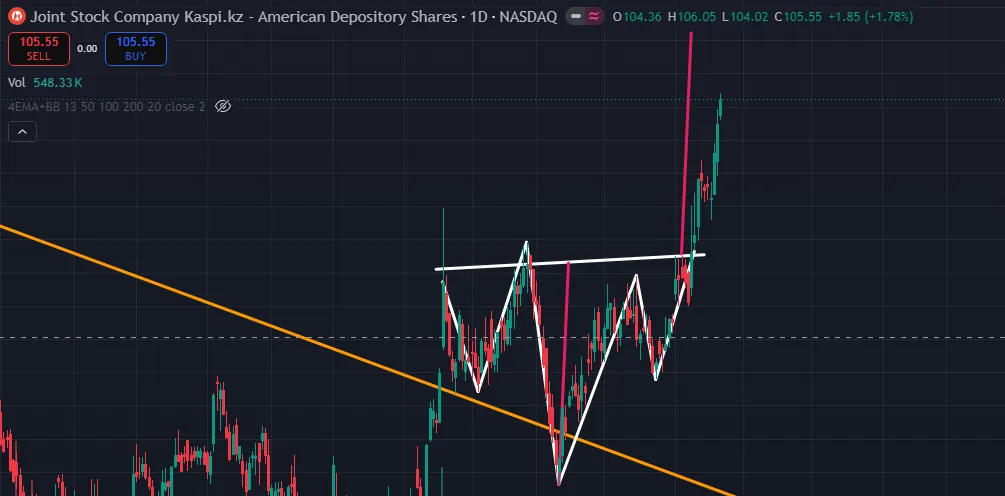
Carrying on following the pattern, its target is around 111 dollars.
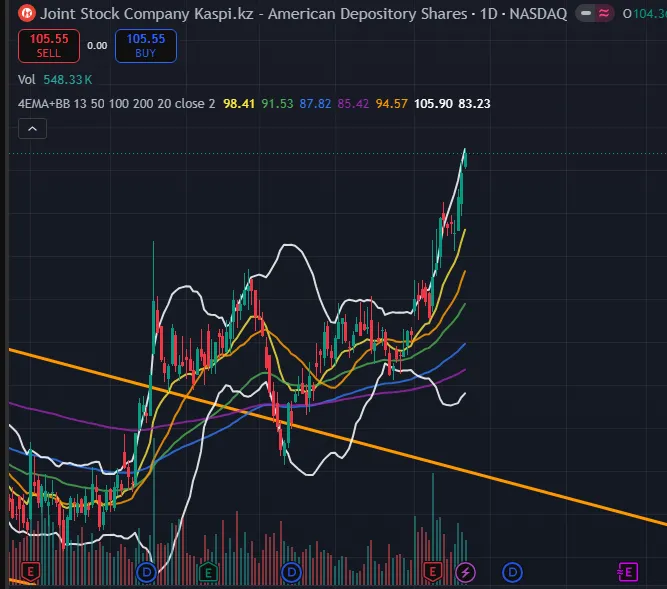
Technically, being above all the most relevant hourly, daily and weekly moving averages (13, 50, 100, 200 periods), the most alarming thing in the short term is being at overbought levels, on the hourly view, on the daily and even on the weekly.



It could be worth waiting for an entry at more relaxed stochastic levels, to spare yourself an unpleasant surprise in the short term, at the risk of “missing the train” that is already moving.
An interesting entry point would be around 100 USD, at the 13-day EMA (the yellow line), counting on the RSI easing off by then.
Risks
Obviously there are underlying risks that I want to list:
1. Country risk and geographic concentration. Practically all of the profit comes from Kazakhstan. It is a country that borders Russia and China, heavily dependent on oil, and with a currency whose rate went from 454 to 506 tenge to the dollar between 2023 and 2025, before recovering to 481 in 2026. As Table 4 shows, this is not a technical detail, it ate more than two thirds of the 2024 profit growth for a shareholder in dollars. A geopolitical crisis in the region, or a sharp fall in oil, hits this company on several sides at the same time, in the currency, in credit and in consumption.
2. Regulation and taxation, and this one is not hypothetical. It has already happened four times in fourteen months. The bank tax rose from 20% to 25% in 2026, the company was pointing to an impact of around 200 basis points on the effective rate, and in the first half the realised effect was larger, 290 basis points (from 18.5% to 21.4%). The National Bank raised minimum reserve requirements in August 2025 and again in April 2026, which directly reduces interest revenue. The regulator can move this company’s result by several percentage points, and has already shown that it does.
3. Execution in Turkey. That is around 1.6 billion dollars committed, a loss of 184 million in the Turkish geography in 2025, an engagement gap of 3.7 times against Kazakhstan, high Turkish inflation, hyperinflationary accounting and political risk. Management says it will run it close to break-even, which in practice means it is not counting on profit from there in the short term. It is the factor that can have the most influence on the company’s share price, up or down.
Conclusion
From the analysis I have done, my conclusion is that there are still two companies inside one here, and that is how I prefer to think about it.
There is a mature Kazakh business, extraordinarily profitable, with a 39% ROE, growing revenue by more than 17% and raising commissions without losing customers, which generates more than 2 billion dollars of profit a year and which, on its own, is probably worth more than the current market capitalisation. And there is an option on Turkey, bought for around 1.6 billion dollars, which is either worth nothing or worth several multiples of that, and whose outcome will not be known before 2027 or 2028. Whoever buys today pays for the first and gets the second practically for free.
At 105 dollars and 9 times earnings the price still looks cheap to me for the quality of the business. I am going to keep the position I hold.
What I will be keeping an eye on, specifically:
- Bad loans stabilising near 7%, and provision coverage not falling any further from 76%.
- The effect of the 100 basis point cut in the three-month deposit rate, which the company says will be seen in the final part of the year. If the cost of funding falls from 14.4%, profit reacts quickly.
- Purchases per consumer on Hepsiburada, which have to keep rising from 2025’s 6.7. It is the only test that matters in Turkey.
- The maintenance and the path of the quarterly dividend. After raising it to KZT 1,000, keeping it there is the test of management’s credibility.
- The first cut in the base rate by the National Bank of Kazakhstan. It is not assumed in the 2026 target, so it is pure upside, with nothing at risk.
- And, for anyone investing in euros, the path of the tenge, which historically was the biggest brake on this company’s return and which in 2026, for the first time, has been helping.
This analysis had to be a little more technical because of how wide-ranging Kaspi’s business is… I hope I have managed to explain the company’s current state and its potential clearly!
My best regards, and good investing!
A note on the numbers
Conversion to dollars at the rates Kaspi itself uses: 454.5 (2023), 525.1 (2024), 505.5 (2025) and 480.72 (30 June 2026) tenge to the dollar. Validation: at these rates, my figures reproduce exactly the dollar amounts the company publishes, that is, revenue of 4,210 / 4,822 / 8,004 M USD and profit of 1,867 / 2,013 / 2,112 M USD in the three financial years, and 4,561 M USD of revenue and 1,063 M USD of profit in the first half of 2026.
The metrics marked as calculated by me (ROE, margins, effective tax rate, net cash excluding deposits, loans to deposits, equity to assets, P/E, P/B, dividend yield, earnings per share for the last twelve months and the 2026 estimate) were derived from the figures above and are not disclosed by the company in this form.
Keep reading
Analysis11 min read
Mota-Engil: The Portuguese Colossus. Is It Worth the Risk?
A fundamental and technical analysis of Mota-Engil at €4.48, because I think the Portuguese construction group is undervalued.
Note2 min read
Grocer's Arithmetic
Mota-Engil's H1 2026 results. Let us get to the arithmetic.