Valuing a company – Technical analysis
What technical indicators are for, what kinds of trader exist depending on the time horizon, and how to read a candlestick without memorising shapes.
By Ricardo Alves · · 6 min de leitura
As I said in the article Valuing a company – Fundamental analysis, to value a company we need to do at least two important pieces of analysis: the technical analysis of the momentum the share price is in, and a fundamental analysis of the company’s fundamentals. Here I am going to explain the basic ideas of technical analysis.
Before we start, I want to set the scene about what makes up the liquidity — the volume of buying and selling — of the stock market. It is not made up only of people: part of it, if not most of it, is made up of algorithms run by software which respond, as people do, to changes in companies’ share prices.
Technical analysis lets us «surf the wave» of these price moves and follow the trends, with the aim of making gains.
Technical analysis
There are several basic ideas, called technical indicators, that we need to understand in order to «surf» the trend. Among them are moving averages (simple and exponential), the RSI (Relative Strength Index), Bollinger Bands, support and resistance zones, trend lines, Fibonacci Retracements, Elliott Waves, the MACD (Moving Average Convergence/Divergence), and others. I am not going to explain them here; I intend to explain them in a space of their own.
Time horizons
In technical analysis there are several kinds of trader, depending on the time frame they use — that is, on the time horizon they look at the chart over. The ideal is to use several, because they can tell us different things. In my opinion, what really matters is not the time frame but setting a plan or a strategy, through both technical and fundamental analysis, and being faithful to that plan. In any case, I will set out below the kinds of trader that exist.
Long-term traders. When doing technical analysis, these investors care more about the long-term trend, looking at price changes on the weekly, monthly or even yearly view. They have defined support zones where they may add to their position — that is, buy more shares — if the price falls to them.
Swing traders. Basically these traders are short- and medium-term investors who have certain targets, and when the price hits that target they sell their position, riding a trend that may last hours, days or weeks. They use the hourly, daily and weekly views more.
Day traders. Unlike swing traders, these sell their position every day, never holding shares overnight, aiming to profit from the price’s volatility over the course of the day. They use the hourly, 30-minute, 15-minute and 5-minute views more.
Scalp traders. These traders turn their positions over with very fast operations on the exchange, lasting minutes or even seconds. Basically the strategy is to buy the shares and sell at a profit at the first possible opportunity. For this kind of trading, the best thing really is to use algorithms, because it is very hard to profit this way when you are trading «against» software that is far faster than we are at «thinking» and «acting».
Given all the above, I will stress again that the most important thing is to set a plan and a strategy and to follow that plan faithfully, keeping our emotional status quo so that we do not fall into greed, nor into fear.
Understanding a candlestick
But how do I actually check the trend, and see the different time horizons, to make my decisions through technical analysis? Well, I personally use the TradingView platform to analyse my listed companies technically, through a large number of the indicators already mentioned here, trying to understand what the trend is «telling me». For that you also need to understand what a candlestick is, because these are what will give us the information about the price’s movement.
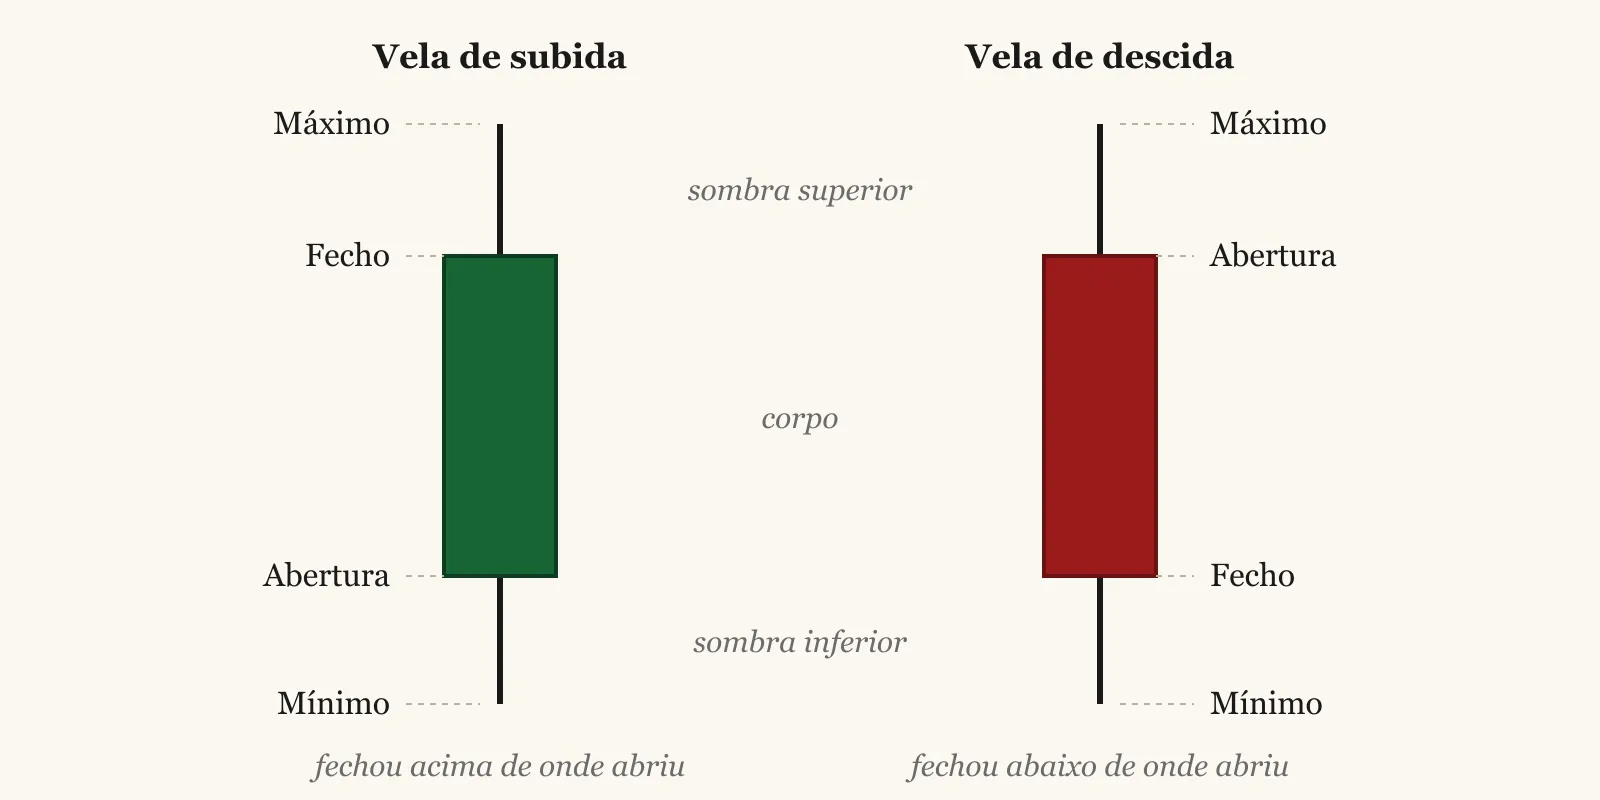
I see a lot on the internet explaining that if the candle looks like this, it is a bullish candle, an upward trend, so we should buy; and if it looks like that, it is a bearish candle, a downward trend, so we should sell.
What really matters is not memorising shapes but understanding what the candle tells us about the price’s movement. Let me give an example to try to explain more easily what I am writing about. As I am a bull by nature, I will use the example of a downtrend reversing.
A share’s price had been in a downtrend, and it even opened at a low price and fell a great deal at the open. But on reaching a certain low, which probably corresponded to a support zone, buyers «came into action» and bought until the price ended up well above the opening value, up on the day. From what I have described, it looks like the reversal of a downtrend, doesn’t it? Well — let me introduce you to the bullish hammer, which means a possible reversal of a downtrend.
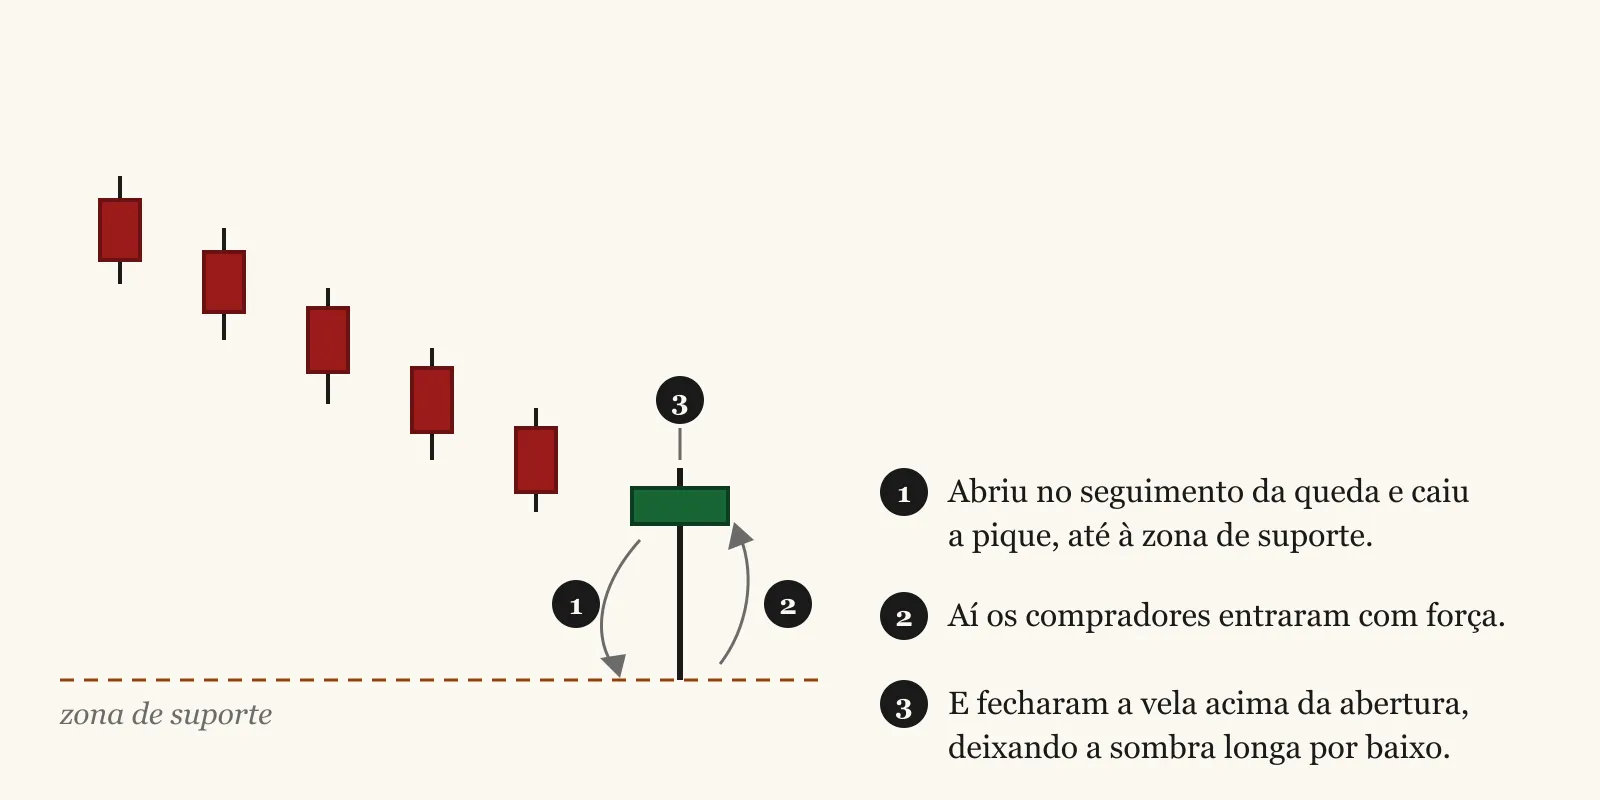
I do not need to memorise that the hammer is a downtrend-reversal candle. It is enough to understand what the candle tells us: that the price fell and was bought hard, and closed up.
Conclusion
Is it possible to make gains over the long run with technical analysis alone? Contrary to what many people would like, the answer is yes! But, unfortunately, only up to a point. It is always important to do a fundamental analysis as well, so we know whether what we are investing in has «legs». Although what technical analysis tells us is no self-evident truth, it is right most of the time. What we do have to bear in mind is that investing over shorter time horizons is not for everyone! It is very frustrating and emotionally hard, it demands a lot of attention and time available to follow price movements, it demands a great deal of emotional stability, and it is quite complex, because we are «competing» against investors with a great deal of market experience and against algorithms that react far faster than we do.
The best thing really is to combine the two kinds of analysis, to have a plan, and not to be attached to one kind of analysis alone. I, for instance, take some long positions based heavily on fundamental analysis and the long-term trend, which I do not intend to sell even if the share falls in the short term. On the other hand, I also open positions in listed companies based heavily on technical analysis: if I have many indicators telling me the trend is upward, or that a fall is reversing in the short term, why not take the risk? I always have my stop-loss — an order that sells the position automatically if the price falls to a level I set — to manage my risk. That said, the positions that gave me the best gains were the ones I opened where both the technical and the fundamental analysis were «telling» me to go in.
Even so, I challenge you to do a technical analysis, with the technical indicators I mentioned above, on a listed company of your own choosing at random, and to check whether the indicators are right or not — most of the time! You may find some fakeouts, but I can tell you that you will find they are often correct.
Thank you for your time!
Keep reading
Literacy6 min read
Valuing a company – Fundamental analysis
What a company's results tell us, why a share falls after announcing rising profits, and the weight of expectations and guidance.
Literacy7 min read
The ABC of investing in shares
Why money sitting still loses value, what shares and ETFs are, how to choose a broker, and what compound interest does to 20 thousand euros over 33 years.